RSS

Fall Market 2025 Favours Buyers

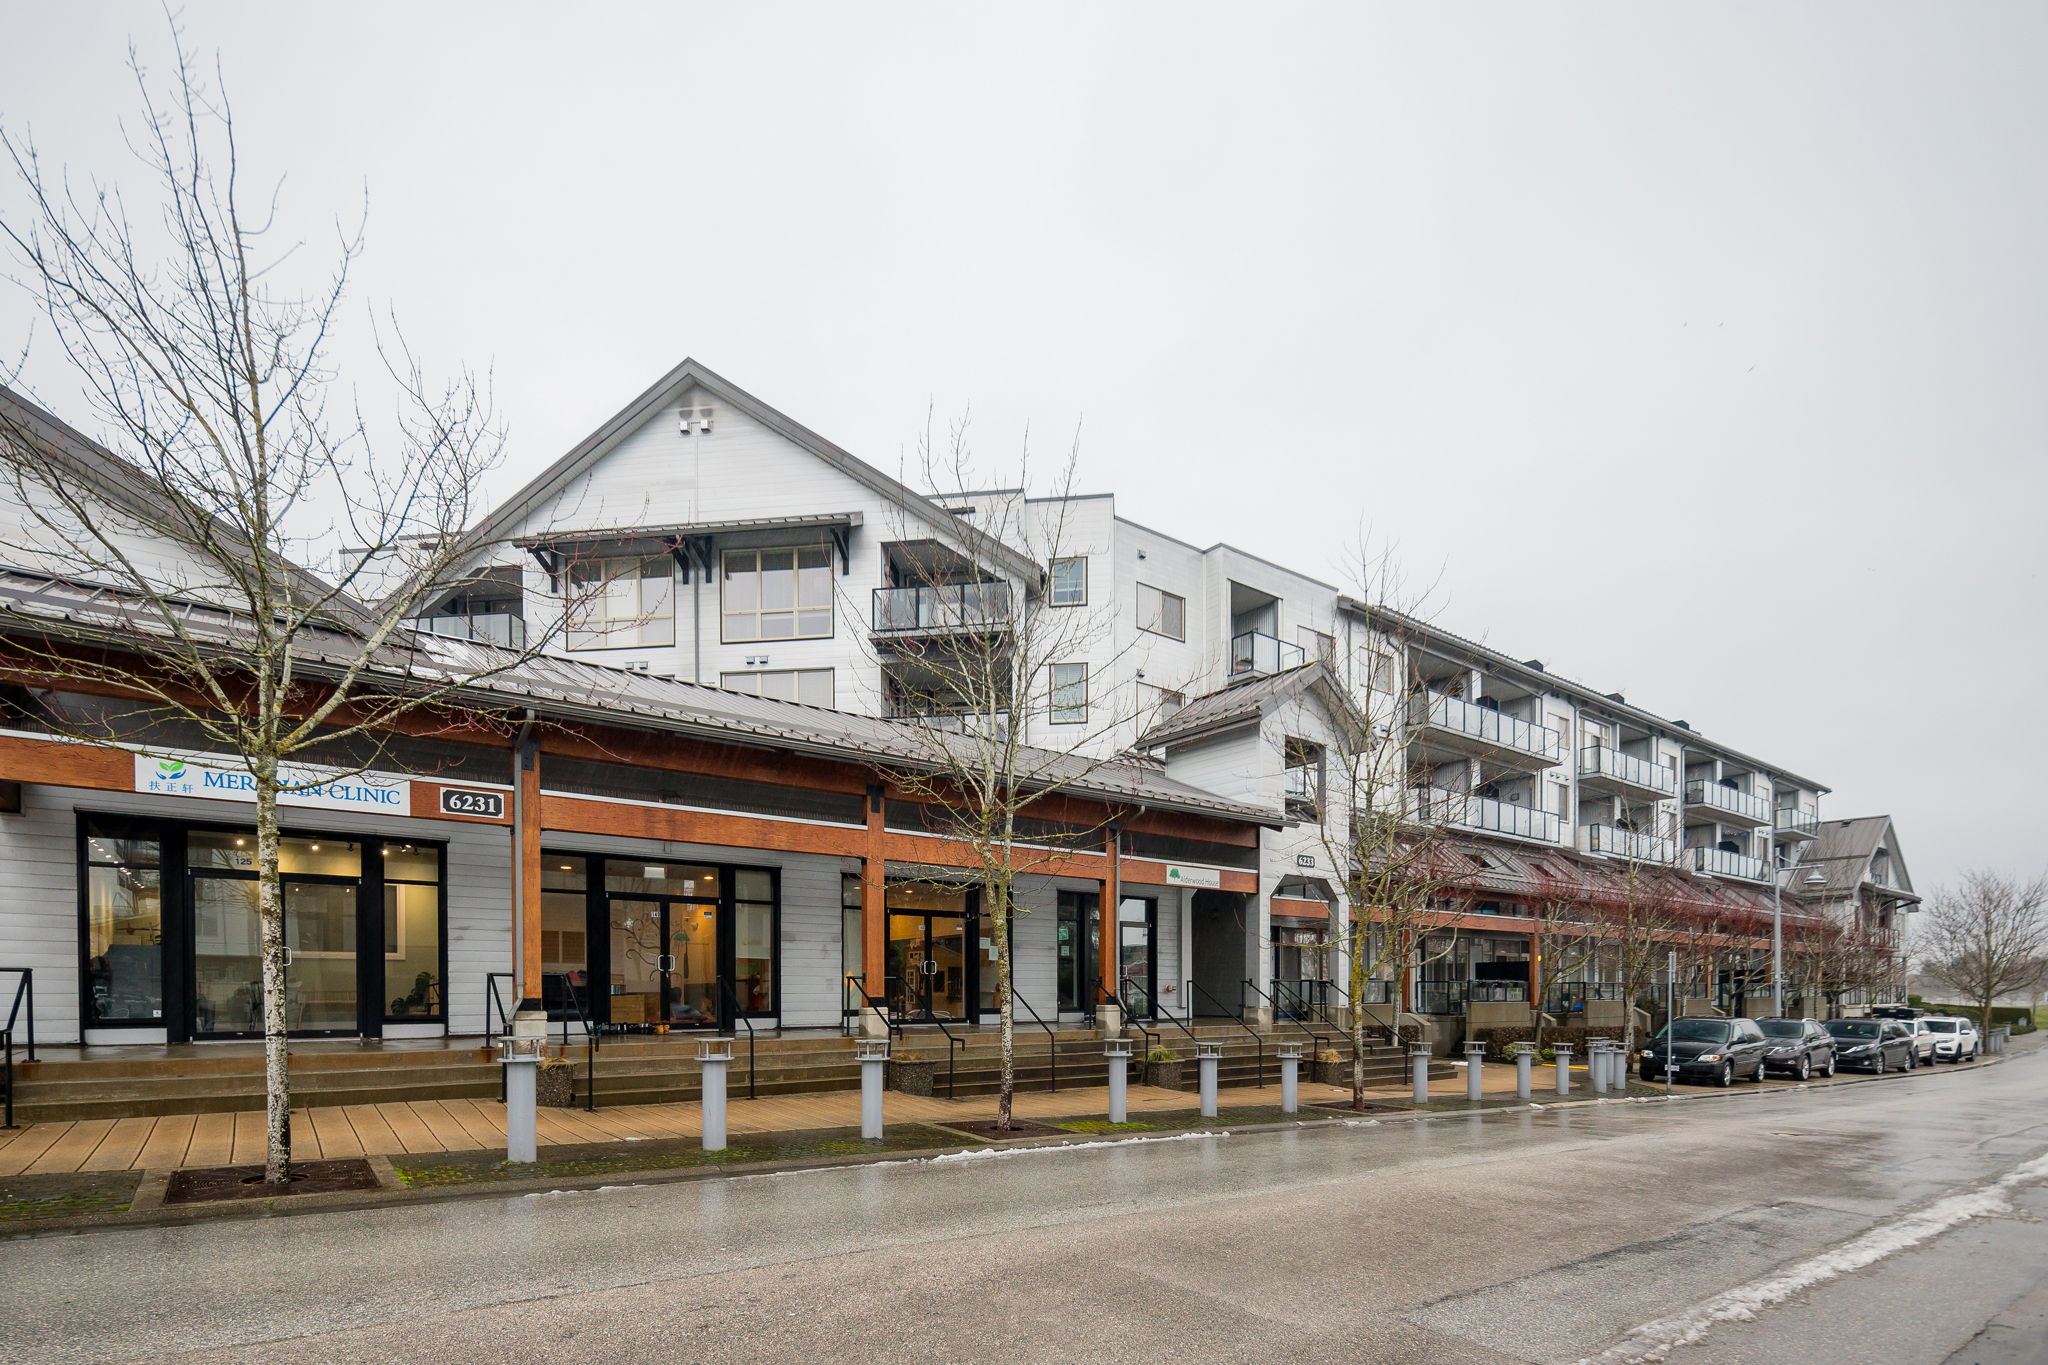
Fall market favours buyers

Another Bank of Canada rate cut and easing prices helped home sales registered on the MLS® in Metro Vancouver* edge higher relative to September last year.  


The Greater Vancouver REALTORS® (GVR) reports that residential sales in the region totalled 1,875 in September 2025, a 1.2 per cent increase from the 1,852 sales recorded in September 2024. This was 20.1 per cent below the 10-year seasonal average (2,348).  


“With another cut to Bank of Canada’s policy rate behind us, and markets pricing in at least one more cut by the end of the year, Metro Vancouver homebuyers have reason to be optimistic about the fall market,” said Andrew Lis, GVR’s director of economics and data analytics.  “Easing prices, near-record high inventory levels, and increasingly favourable borrowing costs are offering those looking to purchase a home this fall with plenty of opportunity.”   


There were 6,527 detached, attached and apartment properties newly listed for sale on the Multiple Listing Service® (MLS®) in Metro Vancouver in September 2025. This represents a 6.2 per cent increase compared to the 6,144 properties listed in September 2024. This was 20.1 per cent above the 10-year seasonal average (5,434).  


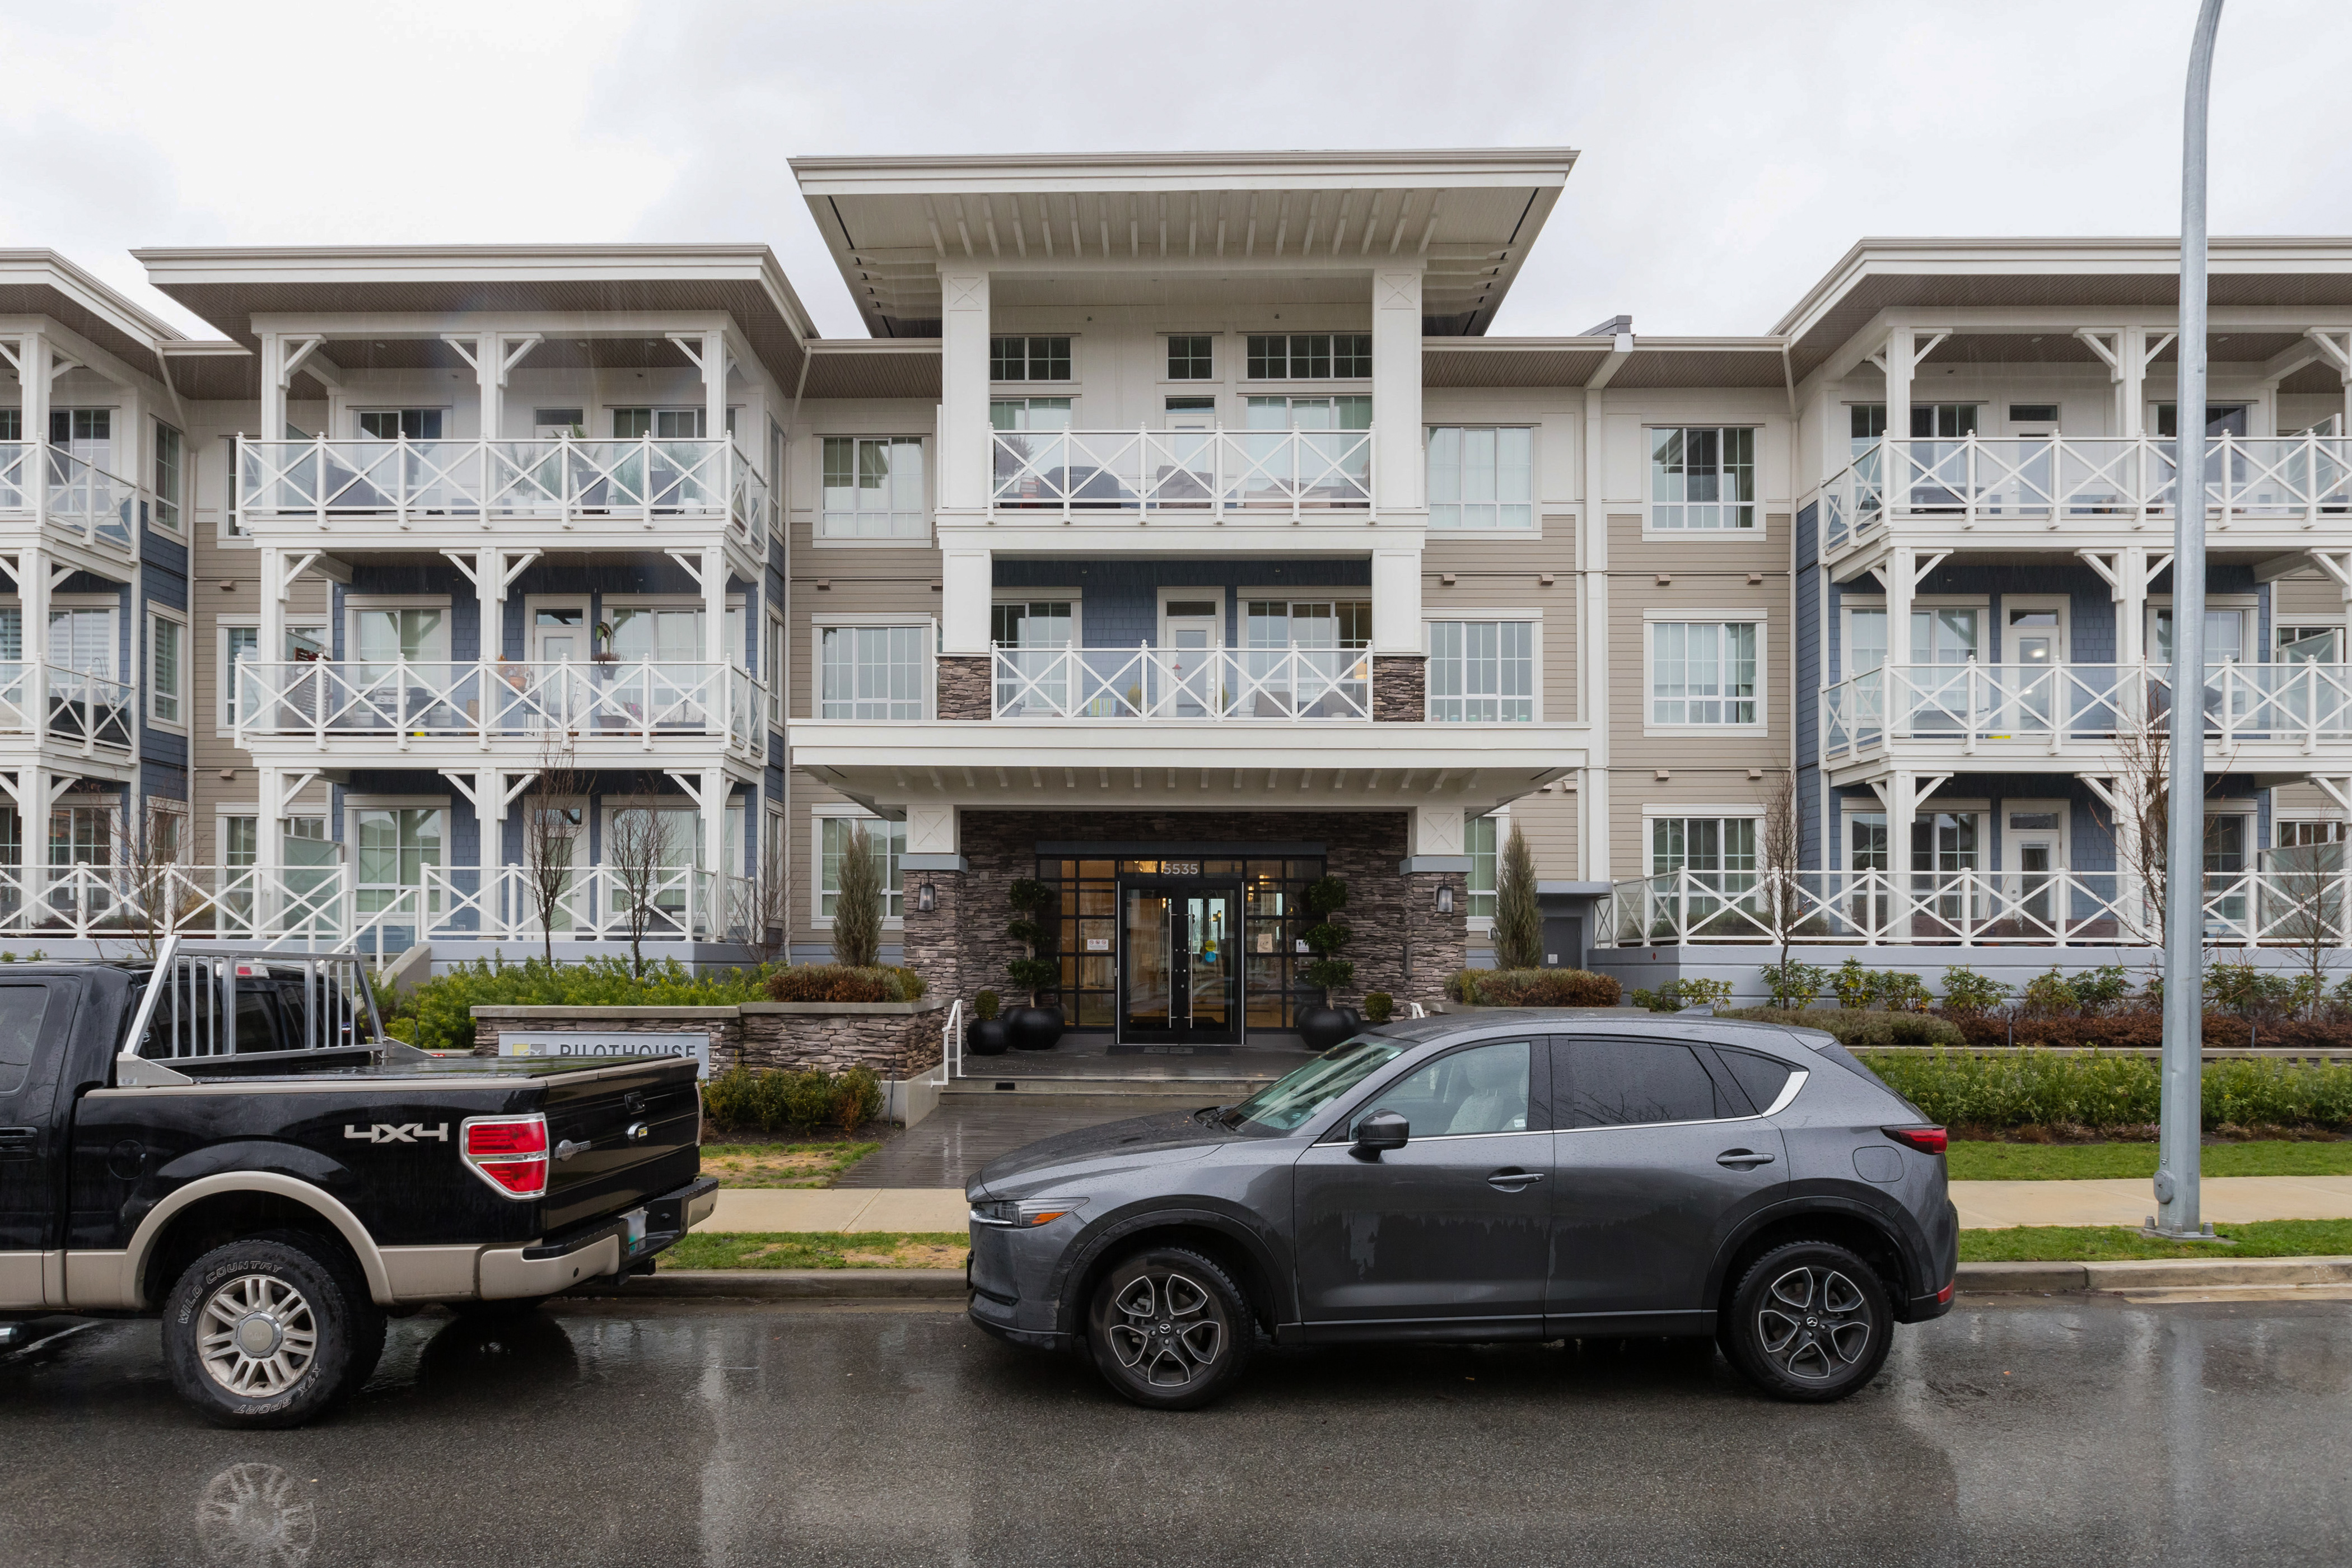
The total number of properties currently listed for sale on the MLS® system in Metro Vancouver is 17,079, a 14.4 per cent increase compared to September 2024 (14,932). This is 36.1 per cent above the 10-year seasonal average (12,553).  


Across all detached, attached and apartment property types, the sales-to-active listings ratio for September 2025 is 11.3 per cent. By property type, the ratio is 8.5 per cent for detached homes, 12.7 per cent for attached, and 13.3 per cent for apartments.  


Analysis of the historical data suggests downward pressure on home prices occurs when the ratio dips below 12 per cent for a sustained period, while home prices often experience upward pressure when it surpasses 20 per cent over several months. 


“The past few years have been quite challenging for the market, beginning with 2022’s rapid increase in interest rates, major political and policy shifts in subsequent years, and recent trade tensions with the USA weighing on the market,” Lis said. “With the acute impacts of these events now fading, we expect market activity to continue stabilizing to end the year, barring any unforeseeable major disruptions.”  


The MLS® Home Price Index composite benchmark price for all residential properties in Metro Vancouver is currently $1,142,100. This represents a 3.2 per cent decrease over September 2024 and a 0.7 per cent decrease compared to August 2025.  


Sales of detached homes in September 2025 reached 552, a 7 per cent increase from the 516 detached sales recorded in September 2024. The benchmark price for a detached home is $1,933,100. This represents a 4.4 per cent decrease from September 2024 and a 0.9 per cent decrease compared to August 2025.  


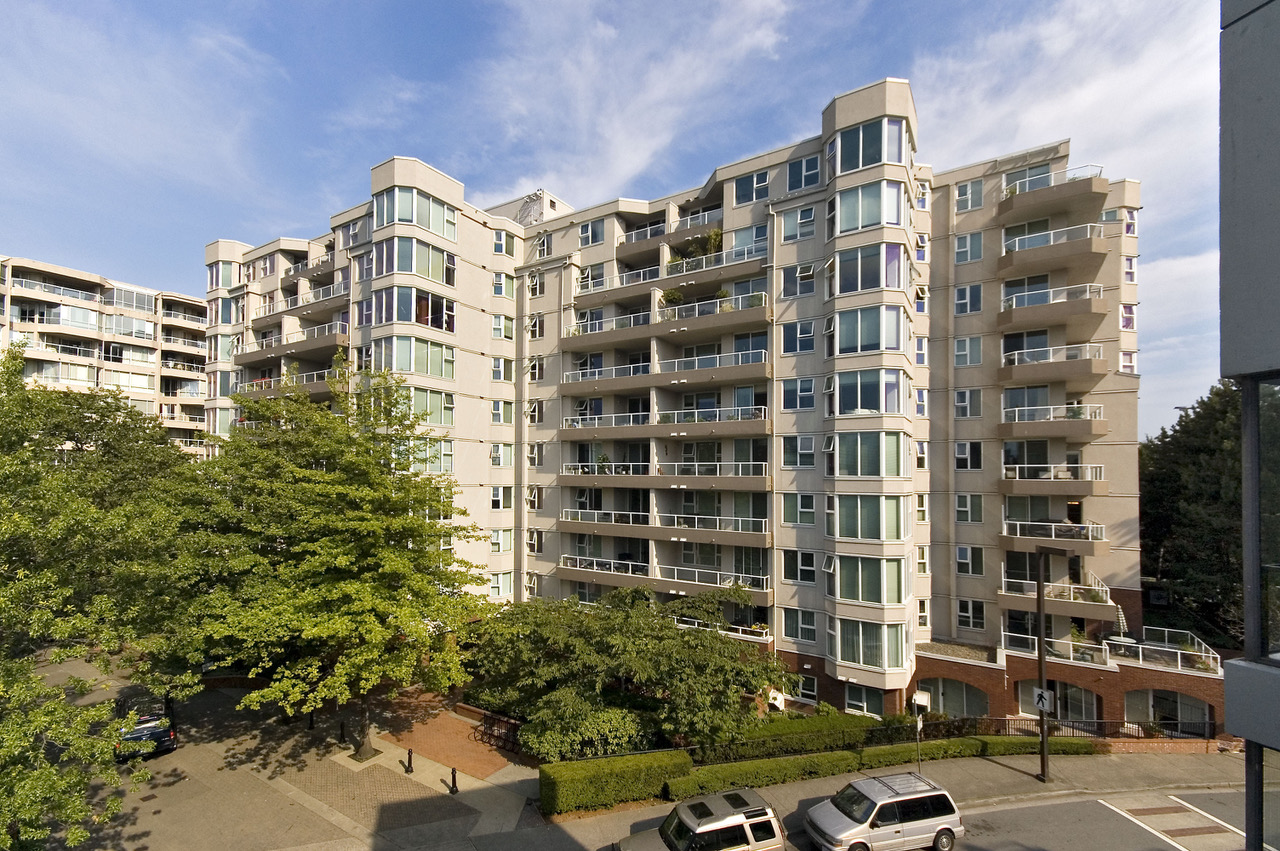
Sales of apartment homes reached 954 in September 2025, a 1.5 per cent increase compared to the 940 sales in September 2024. The benchmark price of an apartment home is $728,800. This represents a 4.4 per cent decrease from September 2024 and a 0.8 per cent decrease compared to August 2025.  


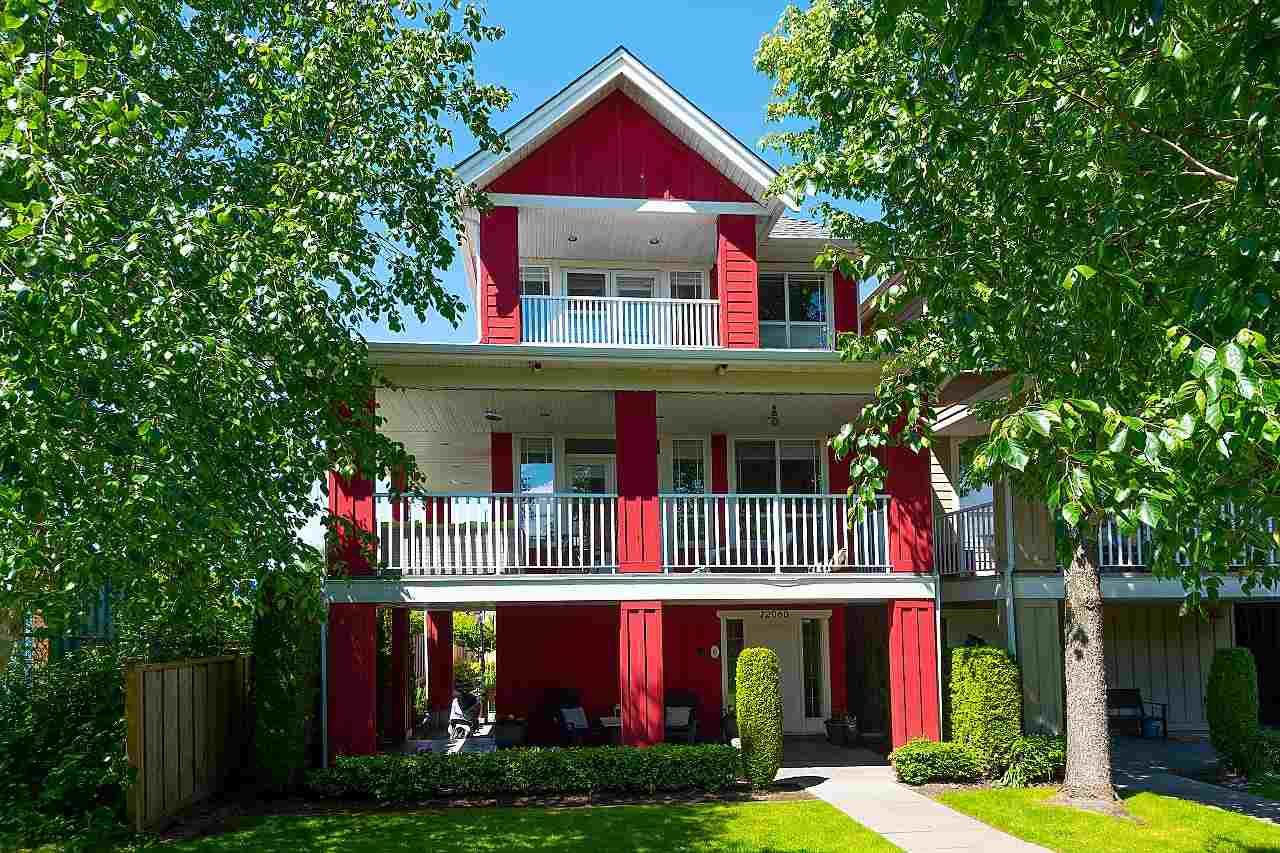
Attached home sales in September 2025 totalled 356, a 5.8 per cent decrease compared to the 378 sales in September 2024. The benchmark price of a townhouse is $1,069,800. This represents a 2.7 per cent decrease from September 2024 and a 0.9 per cent decrease compared to August 2025.

Download GVR's September 2025 MLS® Housing Market Report

Read

Home Sales on the Rise

Home sales register a strong finish to cap off 2024

Home sales registered on the Multiple Listing Service® (MLS®) in Metro Vancouver rose over thirty per cent in December, compared to the previous year, signalling strengthening demand-side momentum to close out 2024. 


The Greater Vancouver REALTORS® (GVR) reports that residential sales in the region totalled 26,561 in 2024, a 1.2 per cent increase from the 26,249 sales recorded in 2023, and a 9.2 per cent decrease from the 29,261 sales in 2022. 


Last year’s sales total was 20.9 per cent below the 10-year annual sales average (33,559).

 
“Looking back on 2024, it could best be described as a pivot year for the market after experiencing such dramatic increases in mortgage rates in the preceding years,” said Andrew Lis, GVR’s director of economics and data analytics. “With borrowing costs now firmly on the decline, buyers have started to show up in numbers after somewhat of a hiatus – and this renewed strength is now clearly visible in the more recent monthly data.” 


Properties listed on the MLS® system in Metro Vancouver totalled 60,388 in 2024. This represents an 18.7 per cent increase compared to the 50,894 properties listed in 2023. This was 9.7 per cent above the 55,047 properties listed in 2022. 


The total number of properties listed last year was 5.7 per cent above the region’s 10-year annual average (57,136). 


Currently, the total number of homes listed for sale on the MLS® system in Metro Vancouver is 10,948, a 24.4 per cent increase compared to December 2024 (8,802). This total is also 25.3 per cent above the 10-year seasonal average (8,737). 


The MLS® Home Price Index composite benchmark price for all residential properties in Metro Vancouver is currently $1,171,500. This represents a 0.5 per cent increase over December 2023 and a 0.1 per cent decrease compared to November 2024. 


“Disappointingly, sales came in shy of our forecasted target for the year, but the December figures signal an emerging pattern of strength in home sales, building on the momentum seen in previous months,” Lis said. “These more recent sales figures are now trending back towards long-term historical averages, which suggests there may still be quite a bit of potential upside for sales as we head into 2025, should the recent strength continue. 


“Although sales activity had a slower start to the year, price trends began 2024 on the rise and closed out the year on a flatter trajectory. Most market segments saw year-over-year increases of a few per cent except for apartment units, which ended 2024 roughly flat. With the data showing renewed strength to finish the year however, it looks as though the 2025 market is positioned to be considerably more active than we’ve seen in recent years.”  

December 2024 summary

Residential sales in the region totalled 1,765 in December 2024, a 31.2 per cent increase from the 1,345 sales recorded in December 2023. This was 14.9 per cent below the 10-year seasonal average (2,074) for the month. 


There were 1,676 detached, attached and apartment properties newly listed for sale on the MLS® system in Metro Vancouver in December 2024. This represents a 26.3 per cent increase compared to the 1,327 properties listed in December 2023. This was 1.1 per cent below the 10-year seasonal average (1,695). 


Across all detached, attached and apartment property types, the sales-to-active listings ratio for December 2024 is 16.8 per cent. By property type, the ratio is 12.1 per cent for detached homes, 23.6 per cent for attached, and 18.7 per cent for apartments. 


Analysis of the historical data suggests downward pressure on home prices occurs when the ratio dips below 12 per cent for a sustained period, while home prices often experience upward pressure when it surpasses 20 per cent over several months. 


Sales of detached homes in December 2024 reached 494, a 31.4 per cent increase from the 376 detached sales recorded in December 2023. The benchmark price for a detached home is $1,997,000. This represents a two per cent increase from December 2023 and is nearly unchanged compared to November 2024. 


Sales of apartment homes reached 891 in December 2024, a 23.9 per cent increase compared to the 719 sales in December 2023. The benchmark price of an apartment home is $749,900. This represents a 0.1 per cent decrease from December 2023 and a 0.4 per cent decrease compared to November 2024. 


Attached home sales in December 2024 totalled 371, a 55.9 per cent increase compared to the 238 sales in December 2023. The benchmark price of a townhouse is $1,114,600. This represents a 3.4 per cent increase from December 2023 and a 0.3 per cent decrease compared to November 2024.  

Download the 2024 year-end stats package

Read

June 2021 Metro Vancouver Housing Market - Buyers Have More Selection Heading Into Summer Months
Read

Spring Ushers In Calmer Housing Market Trends In Metro Vancouver

Spring ushers in calmer housing market trends in Metro Vancouver

After reaching record-setting levels in 2021, home sale activity has returned to more typical seasonal levels in Metro Vancouver this spring due, in large part, to rising interest rates.

The Real Estate Board of Greater Vancouver (REBGV) reports that residential home sales in the region totalled 2,918 in May 2022, a 31.6 per cent decrease from the 4,268 sales recorded in May 2021, and a 9.7 per cent decrease from the 3,232 homes sold in April 2022.

Last month’s sales were 12.9 per cent below the 10-year May sales average.

“With interest rates rising, home buyers are taking more time to make their decisions in today’s housing market,” said Daniel John, REBGV Chair. “Home buyers have been operating in a frenzied environment for much of the past two years. This spring is providing a calmer environment, with fewer multiple offer situations, which is allowing buyers to explore their housing options, understand the changing mortgage market, and do their due diligence.”

There were 6,377 detached, attached and apartment properties newly listed for sale on the Multiple Listing Service® (MLS®) in Metro Vancouver in May 2022. This represents a 10.5 per cent decrease compared to the 7,125 homes listed in May 2021 and a 4.4 per cent increase compared to April 2022 when 6,107 homes were listed.

The total number of homes currently listed for sale on the MLS® system in Metro Vancouver is 10,010, an 8.8 per cent decrease compared to May 2021 (10,970) and a 13.8 per cent increase compared to April 2022 (8,796).

For all property types, the sales-to-active listings ratio for May 2022 is 29.2 per cent. By property type, the ratio is 18.3 per cent for detached homes, 35.5 per cent for townhomes, and 38.1 per cent for apartments.

Generally, analysts say downward pressure on home prices occurs when the ratio dips below 12 per cent for a sustained period, while home prices often experience upward pressure when it surpasses 20 per cent over several months.

The MLS® Home Price Index* composite benchmark price for all residential properties in Metro Vancouver is currently $1,261,1001. This represents a 14.7 per cent increase over May 2021 and a 0.3 per cent decrease compared to April 2022.

“Upward pressure on home prices has begun to ease in the housing market over the last two months,” John said. “Where home prices go next will depend on housing supply. While we’re beginning to see modest increases in home listings, we still need housing supply totals to more than double to bring the market close to balanced territory.”

Sales of detached homes in May 2022 reached 793, a 44.1 per cent decrease from the 1,419 detached sales recorded in May 2021. The benchmark price for a detached home is $2,093,600. This represents a 15 per cent increase from May 2021 and a 0.4 per cent decrease compared to April 2022.

Sales of apartment homes reached 1,605 in May 2022, a 21.7 per cent decrease compared to the 2,049 sales in May 2021. The benchmark price of an apartment home is $779,700. This represents a 15 per cent increase from May 2021 and a 0.4 per cent increase compared to April 2022.

Attached home sales in May 2022 totalled 520, a 35 per cent decrease compared to the 800 sales in May 2021. The benchmark price of an attached home is $1,141,200. This represents a 21.5 per cent increase from May 2021 and a 0.6 per cent decrease compared to April 2022.

Read

March 2021 Metro Vancouver Home Buyer Demand Remains Elevated

Calmer than last spring’s record pace, Metro Vancouver home buyer demand remains elevated


While down from last year’s record numbers, home sale activity in Metro Vancouver’s housing market remained elevated in March.


The Real Estate Board of Greater Vancouver (REBGV) reports that residential home sales in the region totalled 4,344 in March 2022, a 23.9 per cent decrease from the 5,708 sales recorded in March 2021, and a 26.9 per cent increase from the 3,424 homes sold in February 2022. 


Last month’s sales were 25.5 per cent above the 10-year March sales average. 


“March of 2021 was the highest selling month in our history. This year’s activity, while still elevated, is happening at a calmer pace than we experienced 12 months ago,” Daniel John, REBGV Chair said. “Home buyers are keeping a close eye on rising interest rates, hoping to make a move before their locked-in rates expire.” 


There were 6,673 detached, attached and apartment properties newly listed for sale on the Multiple Listing Service® (MLS®) in Metro Vancouver in March 2022. This represents a 19.5 per cent decrease compared to the 8,287 homes listed in March 2021 and a 22 per cent increase compared to February 2022 when 5,471 homes were listed.

 
The total number of homes currently listed for sale on the MLS® system in Metro Vancouver is 7,628, a 16.6 per cent decrease compared to March 2021 (9,145) and a 13.1 per cent increase compared to February 2022 (6,742). 


“We’re still seeing upward pressure on prices across all housing categories in the region. Lack of supply is driving this pressure,” John said. “The number of homes listed for sale on our MLS® system today is less than half of what’s needed to shift the market into balanced territory.” 


For all property types, the sales-to-active listings ratio for March 2022 is 56.9 per cent. By property type, the ratio is 38.8 per cent for detached homes, 73.3 per cent for townhomes, and 70.3 per cent for apartments. 


Generally, analysts say downward pressure on home prices occurs when the ratio dips below 12 per cent for a sustained period, while home prices often experience upward pressure when it surpasses 20 per cent over several months. 


The MLS® Home Price Index composite benchmark price for all residential properties in Metro Vancouver is currently $1,360,500. This represents a 20.7 per cent increase over March 2021 and a 3.6 per cent increase compared to February 2022. 


Sales of detached homes in March 2022 reached 1,291, a 34.3 per cent decrease from the 1,965 detached sales recorded in March 2021. The benchmark price for a detached home is $2,118,600. This represents a 23.4 per cent increase from March 2021 and a 3.6 per cent increase compared to February 2022. 


Sales of apartment homes reached 2,310 in March 2022, a 14.3 per cent decrease compared to the 2,697 sales in March 2021. The benchmark price of an apartment home is $835,500. This represents a 16.8 per cent increase from March 2021 and a 3.4 per cent increase compared to February 2022. 


Attached home sales in March 2022 totalled 743, a 29.0 per cent decrease compared to the 1,046 sales in March 2021. The benchmark price of an attached home is $1,138,300. This represents a 4.4 per cent increase from March 2021 and a 28.1 per cent increase compared to February 2022.


Download the March 2022 stats package.

Read

February 2022 Price Gains Continue in Metro Vancouver's Housing Market

Listings inch up, demand remains steady and price gains continue in Metro Vancouver’s housing market in February


The Metro Vancouver housing market saw steady home sales activity, modest increases in home listings and continued upward trends in pricing in February.


The Real Estate Board of Greater Vancouver (REBGV) reports that residential home sales in the region totalled 3,424 in February 2022, an 8.1 per cent decrease from the 3,727 sales recorded in February 2021, and a 49.8 per cent increase from the 2,285 homes sold in January 2022.


Last month’s sales were 26.9 per cent above the 10-year February sales average.


“As we prepare to enter what’s traditionally the busiest season of the year, the Metro Vancouver housing market is seeing more historically typical home sale activity and a modest uptick in home listing activity compared to last year,” Taylor Biggar, REBGV Chair said.


There were 5,471 detached, attached and apartment properties newly listed for sale on the Multiple Listing Service® (MLS®) in Metro Vancouver in February 2022. This represents an 8.4 per cent increase compared to the 5,048 homes listed in February 2021 and a 31.2 per cent increase compared to January 2022 when 4,170 homes were listed.


The total number of homes currently listed for sale on the MLS® system in Metro Vancouver is 6,742, a 19.3 per cent decrease compared to February 2021 (8,358) and a 19.1 per cent increase compared to January 2022 (5,663).


“Despite having a higher volume of people listing their homes for sale in February, the region’s housing market remains significantly undersupplied, which has been pushing home prices to new highs month after month,” Biggar said.


For all property types, the sales-to-active listings ratio for February 2022 is 50.8 per cent. By property type, the ratio is 34.9 per cent for detached homes, 64.3 per cent for townhomes, and 62.2 per cent for apartments.


Generally, analysts say downward pressure on home prices occurs when the ratio dips below 12 per cent for a sustained period, while home prices often experience upward pressure when it surpasses 20 per cent over several months.


The MLS® Home Price Index composite benchmark price for all residential properties in Metro Vancouver is currently $1,313,400. This represents a 20.7 per cent increase over February 2021 and a 4.6 per cent increase compared to January 2022.


“A lack of housing supply is at the heart of the affordability challenges in Metro Vancouver today. We need more coordinated action from stakeholders at all levels to help create an ample, diverse supply of housing options for residents in the region today and into the future,” Biggar said.


Sales of detached homes in February 2022 reached 1,010, an 18 per cent decrease from the 1,231 detached sales recorded in February 2021. The benchmark price for detached properties is $2,044,800. This represents a 25 per cent increase from February 2021 and a 4.7 per cent increase compared to January 2022.


Sales of apartment homes reached 1,854 in February 2022, a 5.4 per cent increase compared to the 1,759 sales in February 2021. The benchmark price of an apartment property is $807,900. This represents a 15.9 per cent increase from February 2021 and a 4.1 per cent increase compared to January 2022.


Attached home sales in February 2022 totalled 560, a 24 per cent decrease compared to the 737 sales in February 2021. The benchmark price of an attached unit is $1,090,000. This represents a 27.2 per cent increase from February 2021 and a 5.9 per cent increase compared to January 2022.


Download the February 2022 stats package.

Read

Low Supply Keeps Upward Pressure on Home Prices Across Metro Vancouver's Housing Market

Low supply keeps upward pressure on home prices across Metro Vancouver’s housing market


The first month of 2022 saw home sales come down from last year’s record-setting pace, while low supply continued to cause home prices to edge higher across Metro Vancouver. 


The Real Estate Board of Greater Vancouver (REBGV) reports that residential home sales in the region totalled 2,285 in January 2022, a 4.4 per cent decrease from the 2,389 sales recorded in January 2021, and a 15 per cent decrease from the 2,688 homes sold in December 2021. 


Last month’s sales were 25.3 per cent above the 10-year January sales average. 


There were 4,170 detached, attached and apartment properties newly listed for sale on the Multiple Listing Service® (MLS®) in Metro Vancouver in January 2022. This represents a 6.9 per cent decrease compared to the 4,480 homes listed in January 2021 and a 114.4 per cent increase compared to December 2021 when 1,945 homes were listed.  


“Our listing inventory on MLS® is less than half of what would be optimal to begin the year. As a result, hopeful home buyers have limited choice in the market today. This trend is causing fierce competition for a scarce number of homes for sale, which, in turn, increases prices,” Keith Stewart, REBGV economist said. 


The total number of homes currently listed for sale on the MLS® system in Metro Vancouver is 5,663, a 31.8 per cent decrease compared to January 2021 (8,306) and an 8.2 per cent increase compared to December 2021 (5,236). 


“As we approach spring, we’ll keep a close eye on the impact of rising interest rates on buyers’ willingness to buy and on whether more home owners will opt to become sellers in what’s traditionally the busiest season of the year,” Stewart said. “With home prices reaching new highs in recent months, the need has never been greater for government to collaborate with the building community to expedite the creation of housing supply and provide more choice for those struggling to buy a home today.” 


For all property types, the sales-to-active listings ratio for January 2022 is 40.3 per cent. By property type, the ratio is 28 per cent for detached homes, 51.6 per cent for townhomes, and 49.7 per cent for apartments. 


Generally, analysts say downward pressure on home prices occurs when the ratio dips below 12 per cent for a sustained period, while home prices often experience upward pressure when it surpasses 20 per cent over several months. 


The MLS® Home Price Index composite benchmark price for all residential properties in Metro Vancouver is currently $1,255,200. This represents a 18.5 per cent increase over January 2021 and a two per cent increase compared to December 2021. 


Sales of detached homes in January 2022 reached 622, a 15.9 per cent decrease from the 740 detached sales recorded in January 2021. The benchmark price for a detached home is $1,953,000. This represents a 22.7 per cent increase from January 2021 and a 2.2 per cent increase compared to December 2021. 


Sales of apartment homes reached 1,315 in January 2022, a 10 per cent increase compared to the 1,195 sales in January 2021. The benchmark price of an apartment property is $775,700. This represents a 14 per cent increase from January 2021 and a 1.8 per cent increase compared to December 2021. 


Attached home sales in January 2022 totalled 348, a 23.3 per cent decrease compared to the 454 sales in January 2021. The benchmark price of an attached home is $1,029,500. This represents a 24.3 per cent increase from January 2021 and a 2.5 per cent increase compared to December 2021.


Download the January 2022 stats package.

Read

Metro Vancouver Homes Sales Set A Record in 2021

Metro Vancouver home sales set a record in 2021


Metro Vancouver home sales reached an all-time high in 2021 as housing needs remained a top priority for residents in the second year of the COVID-19 pandemic.


The Real Estate Board of Greater Vancouver (REBGV) reports that residential home sales in the region totalled 43,999 in 2021, a 42.2 per cent increase from the 30,944 sales recorded in 2020, a 73.6 per cent increase from the 25,351 homes sold in 2019, and a four per cent increase over the previous all-time sales record of 42,326 set in 2015.


Last year’s sales total was 33.4 per cent above the 10-year sales average.


“Home has been a focus for residents throughout the pandemic. With low interest rates, increased household savings, more flexible work arrangements, and higher home prices than ever before, Metro Vancouverites, in record numbers, are assessing their housing needs and options,” Keith Stewart, REBGV economist said.


Home listings on the Multiple Listing Service® (MLS®) in Metro Vancouver reached 62,265 in 2021. This is a 14.7 per cent increase compared to the 54,305 homes listed in 2020 and a 19.9 per cent increase compared to the 51,918 homes listed in 2019.


Last year’s listings total was 11 per cent above the 10-year average.


“While steady, home listing activity didn't keep pace with the record demand we saw throughout 2021. This imbalance caused residential home prices to rise over the past 12 months,” Stewart said.


The total number of homes currently listed for sale on the MLS® system in Metro Vancouver is 5,236, a 38.7 per cent decrease compared to December 2020 (8,538) and a 26.7 per cent decrease compared to November 2021 (7,144).


“We begin 2022 with just over 5,000 homes for sale across the region. This is the lowest level we’ve seen in more than 30 years,” Stewart said. “With demand at record levels, residents shouldn’t expect home price growth to relent until there’s a more adequate supply of housing available to purchase.”


The MLS® HPI composite benchmark price for all residential properties in Metro Vancouver ends the year at $1,230,200. This is a 17.3 per cent increase compared to December 2020.


Both detached home and townhome benchmark prices increased 22 per cent in the region last year, while apartments increased 12.8 per cent.


Looking across Metro Vancouver, Maple Ridge saw the largest increase in benchmark prices at 34.7 per cent, followed by Pitt Meadows (29.8 per cent), and Whistler (27.8 per cent).


Looking at area and property type, detached homes in Pitt Meadows saw the largest benchmark price increase at 42.2 per cent, followed by detached homes (38.5 per cent) and townhomes (35.2 per cent) in Maple Ridge.


December summary


REBGV reports that residential home sales in the region totalled 2,688 in December 2021, a 13.1 per cent decrease from the 3,093 sales recorded in December 2020, and a 21.6 per cent decrease from the 3,428 homes sold in November 2021.


Last month’s sales were 33.4 per cent above the 10-year December sales average.


There were 1,945 detached, attached and apartment properties newly listed for sale on the MLS® in Metro Vancouver in December 2021. This represents a 19.3 per cent decrease compared to the 2,409 homes listed in December 2020 and a 50.9 per cent decrease compared to November 2021 when 3,964 homes were listed.


For all property types, the sales-to-active listings ratio for December 2021 is 51.3 per cent. By property type, the ratio is 35.1 per cent for detached homes, 75.6 per cent for townhomes, and 60.8 per cent for apartments.


Generally, analysts say downward pressure on home prices occurs when the ratio dips below 12 per cent for a sustained period, while home prices often experience upward pressure when it surpasses 20 per cent over several months.


Sales of detached homes in December 2021 reached 794, a 22.6 per cent decrease from the 1,026 sales recorded in December 2020. The benchmark price for a detached home is $1,910,200. This represents a 22 per cent increase from December 2020 and a 2.1 per cent increase compared to November 2021.


Sales of apartment homes reached 1,464 in December 2021, a 1.4 per cent decrease compared to the 1,474 sales in December 2020. The benchmark price of an apartment home is $761,800. This represents a 12.8 per cent increase from December 2020 and a 1.2 per cent increase compared to November 2021.


Attached home sales in December 2021 totalled 430, a 29.9 per cent decrease compared to the 613 sales in December 2020. The benchmark price of an attached home is $1,004,900. This represents a 22 per cent increase from December 2020 and a 1.5 per cent increase compared to November 2021.

Read

September 2021 Elevated Home Sale Activity Continues to Outstrip Supply of Homes for Sale in Metro Vancouver

Elevated home sale activity continues to outstrip the supply of homes for sale in Metro Vancouver 


Home sale activity remains elevated across Metro Vancouver’s housing market while the pace of homes being listed for sale continues to follow long-term averages.


The Real Estate Board of Greater Vancouver (REBGV) reports that residential home sales in the region totalled 3,149 in September 2021, a 13.6 per cent decrease from the 3,643 sales recorded in September 2020, and a 0.1 per cent decrease from the 3,152 homes sold in August 2021. 


Last month’s sales were 20.8 per cent above the 10-year September sales average. 


There were 5,171 detached, attached and apartment properties newly listed for sale on the Multiple Listing Service® (MLS®) in Metro Vancouver in September 2021. This represents a 19.2 per cent decrease compared to the 6,402 homes listed in September 2020 and a 28.2 per cent increase compared to August 2021 when 4,032 homes were listed. 


September’s new listings were 1.2 per cent below the 10-year average for the month. 


“The summer trend of above-average home sales and historically typical new listings activity continued in Metro Vancouver last month. Although this is keeping the overall supply of homes for sale low, we’re not seeing the same upward intensity on home prices today as we did in the spring,” Keith Stewart, REBGV economist said. “Home price trends will, however, vary depending on property type and neighborhood, so it’s important to take a hyperlocal look at your location and property category of choice before making a home buying or selling decision.” 


The total number of homes currently listed for sale on the MLS® system in Metro Vancouver is 9,236. This is a 29.5 per cent decrease compared to September 2020 (13,096), a 2.6 per cent increase compared to August 2021 (9,005) and is 27.7 per cent below the 10-year average for the month. 


For all property types, the sales-to-active listings ratio for September 2021 is 34.1 per cent. By property type, the ratio is 25.5 per cent for detached homes, 53.1 per cent for townhomes, and 36.7 per cent for apartments. 


Generally, analysts say downward pressure on home prices occurs when the ratio dips below 12 per cent for a sustained period, while home prices often experience upward pressure when it surpasses 20 per cent over several months. 


“The total inventory of homes for sale remains insufficient to meet the demand in today’s market. This scarcity limits peoples’ purchasing options and ultimately adds upward pressure on home prices,” Stewart said. “With the federal election now behind us, we hope to see governments at all levels work with the construction industry to streamline the creation of a more abundant and diverse supply of housing options.” 


The MLS® Home Price Index composite benchmark price for all residential properties in Metro Vancouver is currently $ 1,186,100. This represents a 13.8 per cent increase over September 2020 and a 0.8 per cent increase compared to August 2021. 


Sales of detached homes in September 2021 reached 950, a 27.9 per cent decrease from the 1,317 detached sales recorded in September 2020. The benchmark price for a detached home is $1,828,200. This represents a 20.4 per cent increase from September 2020 and a 1.2 per cent increase compared to August 2021. 


Sales of apartment homes reached 1,621 in September 2021, a 1.6 per cent increase compared to the 1,596 sales in September 2020. The benchmark price of an apartment home is $738,600. This represents an 8.4 per cent increase from September 2020 and a 0.5 per cent increase compared to August 2021. 


Attached home sales in September 2021 totalled 578, a 20.8 per cent decrease compared to the 730 sales in September 2020. The benchmark price of an attached home is $963,800. This represents a 17.5 per cent increase from September 2020 and a 1.2 per cent increase compared to August 2021.


Download the September 2021 stats package.

Read

Home Sale and Listing Resurgence Extends Into The Fall

Home sale and listing resurgence extends into the fall


Home sale and new listing activity remained at near record levels across Metro Vancouver in October.


The Real Estate Board of Greater Vancouver (REBGV) reports that residential home sales in the region totalled 3,687 in October 2020, a 29 per cent increase from the 2,858 sales recorded in October 2019, and a 1.2 per cent increase from the 3,643 homes sold in September 2020.


Last month’s sales were 34.7 per cent above the 10-year October sales average and stands as the second-highest total on record for the month.


“Home has been a focus for residents during the pandemic. With more days and evenings spent at home this year, people are re-thinking their housing situation," Colette Gerber, REBGV Chair said. “Throughout this period, REALTORS® have been working to understand and adapt to the latest safety protocols so that they can continue to help the public meet their housing needs in a safe and responsible way.”


There were 5,571 detached, attached and apartment homes newly listed for sale on the Multiple Listing Service® (MLS®) in Metro Vancouver in October 2020. This represents a 36.7 per cent increase compared to the 4,074 homes listed in October 2019 and a 13 per cent decrease compared to September 2020 when 6,402 homes were listed. 


The total number of homes currently listed for sale on the MLS® system in Metro Vancouver is 12,416, a 1.5 per cent increase compared to October 2019 (12,236) and a 5.2 per cent decrease compared to September 2020 (13,096).


 “With demand on the rise, homes priced right for today’s market are receiving attention and, at times, garnering multiple offers," Gerber said. "To understand the market conditions in your neighbourhood and property type of choice, work with your local REALTOR® to assess the latest MLS® housing market information."


For all property types, the sales-to-active listings ratio for October 2020 is 29.7 per cent. By property type, the ratio is 30.9 per cent for detached homes, 43.5 per cent for townhomes, and 24.9 per cent for apartments.


Generally, analysts say downward pressure on home prices occurs when the ratio dips below 12 per cent for a sustained period, while home prices often experience upward pressure when it surpasses 20 per cent over several months.


The MLS® Home Price Index composite benchmark price for all residential properties in Metro Vancouver is currently $1,045,100. This represents a six per cent increase over October 2019 and a 0.4 per cent increase compared to September 2020.


Sales of detached homes in October 2020 reached 1,335, a 42.3 per cent increase from the 938 detached sales recorded in October 2019. The benchmark price for a detached home is $1,523,800. This represents an 8.5 per cent increase from October 2019 and a 1.1 per cent increase compared to September 2020.


Sales of apartment homes reached 1,570 in October 2020, a 13.4 per cent increase compared to the 1,384 sales in October 2019. The benchmark price of an apartment property is $683,500. This represents a 4.4 per cent increase from October 2019 and is unchanged compared to September 2020.


Attached home sales in October 2020 totalled 782, a 45.9 per cent increase compared to the 536 sales in October 2019. The benchmark price of an attached home is $813,000. This represents a 5.4 per cent increase from October 2019 and a 0.4 per cent increase compared to September 2020.

Download the October 2020 stats package

Read

Metro Vancouver home sales and listings surge in September

Home sale and new listing activity reached record levels in Metro Vancouver in September.

The Real Estate Board of Greater Vancouver (REBGV) reports that residential home sales in the region totalled 3,643 in September 2020, a 56.2 per cent increase from the 2,333 sales recorded in September 2019, and a 19.6 per cent increase from the 3,047 homes sold in August 2020.

Last month’s sales were 44.8 per cent above the 10-year September sales average and is the highest total on record for the month.

“We've seen robust home sale and listing activity across Metro Vancouver throughout the summer months," Colette Gerber, REBGV Chair said. "This increased activity can be attributed, in part, to lower interest rates and changing housing needs during the COVID-19 pandemic."

There were 6,402 detached, attached and apartment properties newly listed for sale on the Multiple Listing Service® (MLS®) in Metro Vancouver in September 2020. This represents a 31.6 per cent increase compared to the 4,866 homes listed in September 2019 and a 10.1 per cent increase compared to August 2020 when 5,813 homes were listed.

The total number of homes currently listed for sale on the MLS® system in Metro Vancouver is 13,096, a 2.6 per cent decrease compared to September 2019 (13,439) and a 2.3 per cent increase compared to August 2020 (12,803).

"While the pace of new MLS® listings entering the market is increasing, the heightened demand from home buyers is keeping overall supply levels down," Gerber said. "This is creating upward pressure on home prices, which have been edging up since the spring."

For all property types, the sales-to-active listings ratio for September 2020 is 27.8 per cent. By property type, the ratio is 28.3 per cent for detached homes, 36.1 per cent for townhomes, and 24.8 per cent for apartments.

Generally, analysts say downward pressure on home prices occurs when the ratio dips below 12 per cent for a sustained period, while home prices often experience upward pressure when it surpasses 20 per cent over several months.

The MLS® Home Price Index composite benchmark price for all residential properties in Metro Vancouver is currently $1,041,300. This represents a 5.8 per cent increase over September 2019, and a 0.3 per cent increase compared to August 2020.

Sales of detached homes in September 2020 reached 1,317, a 76.8 per cent increase from the 745 detached sales recorded in September 2019. The benchmark price for detached properties is $1,507,500. This represents a 7.8 per cent increase from September 2019 and a 1.1 per cent increase compared to August 2020.

Sales of apartment homes reached 1,596 in September 2020, a 36.9 per cent increase compared to the 1,166 sales in September 2019. The benchmark price of an apartment property is $683,500. This represents a 4.5 per cent increase from September 2019 and a 0.3 per cent decrease compared to August 2020.

Attached home sales in September 2020 totalled 730, a 73 per cent increase compared to the 422 sales in September 2019. The benchmark price of an attached unit is $809,900. This represents a 5.2 per cent increase from September 2019 and a 0.4 per cent increase compared to August 2020.

Download the September 2020 stats package

Read

Home sale and listing activity continues to increase in August

Home buyers and sellers remained active across Metro Vancouver in August, with home sale and new listing activity outpacing the region’s historical averages.

The Real Estate Board of Greater Vancouver (REBGV) reports that residential home sales in the region totalled 3,047 in August 2020, a 36.6 per cent increase from the 2,231 sales recorded in August 2019, and a 2.6 per cent decrease from the 3,128 homes sold in July 2020.

Last month’s sales were 19.9 per cent above the 10-year August sales average.

“People who put their home buying and selling plans on hold in the spring have been returning to the market throughout the summer,” Colette Gerber, REBGV Chair said. “Like everything else in our lives these days, the uncertainty COVID-19 presents makes it challenging to predict what will happen this fall.”

There were 5,813 detached, attached and apartment properties newly listed for sale on the Multiple Listing Service® (MLS®) in Metro Vancouver in August 2020. This represents a 55.1 per cent increase compared to the 3,747 homes listed in August 2019 and a 2.3 per cent decrease compared to July 2020 when 5,948 homes were listed.

This was 34.8 per cent above the 10-year August new listings average.

The total number of homes currently listed for sale on the MLS® system in Metro Vancouver is 12,803, a 4.4 per cent decrease compared to August 2019 (13,396) and a six per cent increase compared to July 2020 (12,083).

For all property types, the sales-to-active listings ratio for August 2020 is 23.8 per cent. By property type, the ratio is 23.7 per cent for detached homes, 30.5 per cent for townhomes, and 21.6 per cent for apartments.

Generally, analysts say downward pressure on home prices occurs when the ratio dips below 12 per cent for a sustained period, while home prices often experience upward pressure when it surpasses 20 per cent over several months.

“Low interest rates and limited overall supply of homes for sale are creating competition in today’s housing market,” Gerber said. “Your local REALTOR® can help you navigate today’s market and ensure that the latest public health requirements are followed at every step of the process. Above all, safety has to remain our top priority during this pandemic.”

The MLS® Home Price Index composite benchmark price for all residential properties in Metro Vancouver is currently $1,038,700. This represents a 5.3 per cent increase over August 2019 and a 0.7 per cent increase compared to July 2020.

Sales of detached homes in August 2020 reached 1,095, a 55.1 per cent increase from the 706 detached sales recorded in August 2019. The benchmark price of a detached home is $1,491,300. This represents a 6.6 per cent increase from August 2019 and a one per cent increase compared to July 2020.

Sales of apartment homes reached 1,332 in August 2020, a 19.4 per cent increase compared to the 1,116 sales in August 2019. The benchmark price of an apartment property is $685,800. This represents a 4.5 per cent increase from August 2019 and a 0.5 per cent increase compared to July 2020.

Attached home sales in August 2020 totalled 620, a 51.6 per cent increase compared to the 409 sales in August 2019. The benchmark price of an attached home is $806,400. This represents a 4.4 per cent increase from August 2019 and a 1.1 per cent increase compared to July 2020.

Download the August 2020 stats package

Read
Reciprocity Logo The data relating to real estate on this website comes in part from the MLS® Reciprocity program of either the Greater Vancouver REALTORS® (GVR), the Fraser Valley Real Estate Board (FVREB) or the Chilliwack and District Real Estate Board (CADREB). Real estate listings held by participating real estate firms are marked with the MLS® logo and detailed information about the listing includes the name of the listing agent. This representation is based in whole or part on data generated by either the GVR, the FVREB or the CADREB which assumes no responsibility for its accuracy. The materials contained on this page may not be reproduced without the express written consent of either the GVR, the FVREB or the CADREB.